- The Basics of Data Analytics – Definition, Benefits, Limitations, and Career
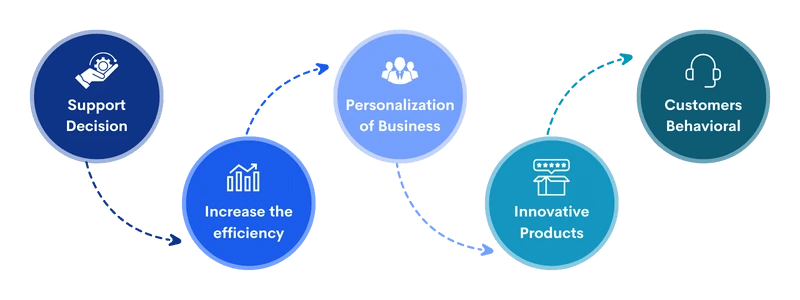
- 5 powerful benefits of data analytics
- Types of Data Analytics and Their Benefits?
- Challenges of Data Analytics and ways to overcome
- How has Data Analytics proved Beneficial Across Various Industries?
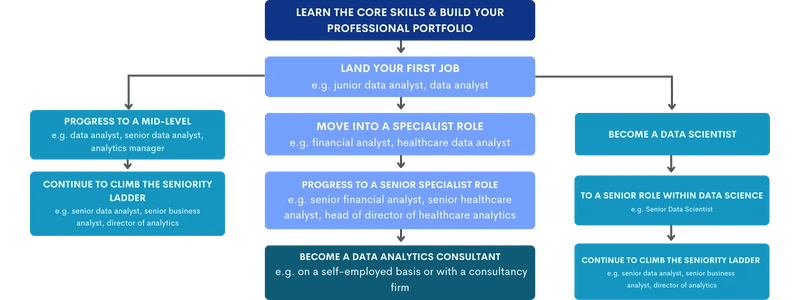
- Career Scope in Data Analytics
- Why Should You Choose Data Analyst as Your Career?
- Conclusion
The Basics of Data Analytics
In today's business world, data is the key to success. It drives growth and helps make informed decisions. Data analytics is the tool that transforms raw information into valuable insights. It allows businesses to be more productive and understand their customers better. The COVID-19 pandemic has made a tremendous increase in data creation. People worldwide rely more on digital solutions and technology, resulting in humans generating 90% of the world's data in just the last two years. As a result, businesses need basics of data analytics to organize, store, and analyze this overwhelming amount of data. This blog post will give a detailed understanding of data analytics, making it the perfect place to learn more about the subject. So let's dive in and explore!
What is Data Analytics?
Data analytics is about looking at different data types for valuable insights. The goal is to gather, organize, and analyze data to make intelligent business decisions. Learning basics of Data analytics helps businesses make data-based decisions, find opportunities, reduce risks, and improve performance.
The importance of data analytics is growing quickly 97.2% of businesses are investing in big data and AI, driving economic growth in the 21st century. Data analytics processes big data to give valuable insights and is essential for businesses. Other parts of data analytics show how important it is:
- It helps businesses stay competitive by finding trends and insights.
- It improves understanding of customers and products or services.
- It finds risks and opportunities for better decisions.
- It makes operations better and saves money.
- It finds patterns and makes discoveries.
- It follows the rules and keeps data safe.
To sum it up, data analytics turns data into insights for better decisions and performance.Let's look at it each at a time

5 powerful benefits of data analytics
1. Improving Productivity and Efficiency
Data analytics tools can help organizations become more productive and efficient in simple ways:
- Data analysis helps identify where things are not working well, so organizations can focus on improving them.
- Data insights help organizations make intelligent decisions about using their resources effectively and getting the most out of them.
- Data analysis helps organizations care for their equipment by predicting when maintenance is needed so it doesn't break down unexpectedly.
- Data analytics quickly determines easy and repetitive jobs and finds ways to do them automatically, saving time and reducing mistakes.
- Real-time monitoring and alerts from data analytics help organizations catch and fix issues fast so they don't cause delays or disruptions.
- By looking at past data, organizations can get a good idea of what customers will want in the future, helping them plan and prepare in advance.
- Data analysis helps identify which employees are doing well and where others might need more support or training so that everyone can work at their best.
2. Making Better Decisions
Data analytics helps organizations make more intelligent choices with data. It finds opportunities, reduces risks, simplifies processes, and guides strategy. Here's how it helps:
- Data-driven decisions: Using facts, not guesses, for better choices.
- Finding areas to improve: Analyzing data to enhance.
- Understanding the market and customers: Gaining insights for effective strategies.
- Detecting fraud and trends: Spotting patterns to prevent fraud and stay ahead.
- Assessing strengths and weaknesses: Analyzing data to improve performance.
- Expanding opportunities: Discovering untapped growth potential.
In summary, data analytics improves decision-making by using data for better choices, finding areas to improve, understanding the market and customers, detecting fraud and trends, assessing strengths and weaknesses, and expanding opportunities.
3. Increase Customer Understanding and Personalization
Data analytics helps businesses understand customers and personalize their experiences. As a result, it increases quick sales and enhances brand loyalty. Here's how it works:
- Puts customers into different groups based on age, interests, and preferences.
- Look at what customers buy, how they browse, and how they interact. It helps businesses understand what customers like and how they behave.
- It helps create exceptional marketing for each customer. It makes customers feel important and satisfied.
- Identifies customers who spend the most or are the most loyal. Businesses can focus on them and keep them happy.
In short, the basics of data analytics helps businesses understand customers and create personalized experiences. It involves grouping customers, knowing their behaviour, and finding valuable customers. Using data analytics, companies can make customers happy and build strong relationships.
4. Identifying business opportunities:
- Data analytics helps businesses discover new opportunities. It's a powerful tool for startups and established companies, driving growth and innovation. Let us look at its benefits and ways it improves businesses.
- Understand the market better, finding new chances.
- Businesses learn about customer preferences, trends, and needs by analyzing data, leading to practical opportunities.
- Look at customer willingness to pay, competition, and market trends, helping businesses find profitable opportunities.
- Find strategies to attract and keep customers, creating more chances. Many companies use this strategy to boost sales and revenue for businesses.
- Provide insights into processes, supply chains, and resources, showing efficient work methods.
Doesn't it sound simple? While it can do a lot more than this! With the help of our blog on basics of data analytics. Businesses can find opportunities, stay ahead, and grow successfully.
5. Risk management:
The primary use of data analytics is risk management. It focuses on how effectively it can tackle risks and return to normal. What more? It can destroy threats using historical data too. So let's see how it helps.
- It spots and prevents fraud by analyzing data and performance indicators.
- Identifies non-compliance and deviations from norms, ensuring adherence to regulations.
- Assesses future risks and simulates scenarios to predict outcomes.
- Examines supplier data, market trends, and demand patterns to uncover weaknesses and potential disruptions.
- Analyzes historical data and consumer insights to identify crucial processes, dependencies, and weaknesses, improving operations and reducing risks.
It equips you with valuable skills for risk management. Moreover, the resource is free to use. And that makes it unique.
Types of Data Analytics and Their Benefits?
Data analytics contains various techniques and methods to make informed and data-driven decisions. Different types of data analytics are utilized depending on the objectives and needs of the questions. The four primary types of data analytics are descriptive, diagnostic, perspective, and predictive. Each class has unique advantages and is essential in assisting organizations. Want to know more? Let's learn more about all four types of data analysis in detail, with their respective benefits:
1. Descriptive Analysis
Descriptive analytics helps us understand and explain past events and what is currently occurring. It involves analyzing historical data to find patterns and trends. This information is valuable because it gives us insights into past performance, customer behaviour, and market trends.
It is the starting point for advanced data analysis techniques, such as predictive modelling and prescriptive analytics. It simplifies complex information and helps us make better decisions based on historical context. Isn't that amazing?
Benefits of Descriptive Analysis
This domain has significant advantages. Check out the benefits below. These help you gain insights and help you know where your strategy is failing. Let's read!
- It helps us explore and understand past performance, consumer behaviour, and market trends. This knowledge is crucial for strategic planning.
- Enables simple decision-making by providing insights into recorded data. By analyzing trends and patterns, businesses can make more informed choices.
- Track metrics and measure key performance indicators (KPIs). It also allows them to assess their performance over time and identify areas for improvement.
- Simplifies data analysis by presenting information in easy-to-understand formats. Charts, graphs, and dashboards help stakeholders analyze demographic data effectively.
Analysis of anything and everything is the central part when it comes to business. Then, implement the right strategy and see your business propelling to heights!
2. Diagnostic Analysis
Did you know that diagnostic analysis is like being a detective for data? Like how detectives solve mysteries, diagnostic analysis helps us solve problems using information and clues from data.
It's like finding shortcuts or better ways to do things. Diagnostic analytics helps us figure out why things happen by studying data patterns. It helps us uncover the reasons behind specific outcomes and find solutions for past problems. Use this type of analysis for the detailed identification of issues. Let's look at some more examples.
Benefits of Diagnostic Analysis
- Identify why anomalies, performance gaps, or operational issues occur.
- Identifying and fixing the leading problems by analyzing data and finding cause-and-effect relationships.
- Discovering inefficiencies improves workflows, productivity, and overall operations.
- Taking corrective actions, monitoring their effects over time, and addressing the root causes of problems.
The diagnostic analysis is all about using data to solve problems and improve things. It's like being a detective and a problem solver at the same time. We can find solutions and enhance our everyday lives by understanding why things happen. It's that simple and easy.
3. Predictive Analysis
Have you ever tried to predict something? Like guessing your favourite ice cream flavour or which team will win a game? Well, predictive analysis is like that, but with numbers and data! Predictive analytics predicts the future using data and models. It helps businesses anticipate trends, customer behaviour, and market changes by finding patterns in data. As a result, it helps them reduce risk and stay ahead by reducing errors.
Benefits of Predictive Analytics:
- More Revenue: It helps companies find new income sources and boost productivity.
- Competitive Advantage: Predictive analytics keeps businesses ahead of their rivals.
- Improved Efficiency: Analyzing assets and employee productivity enhances production and quality.
- Risk Detection: It identifies potential risks and helps manage them effectively.
But it's important to remember that predictions are only sometimes 100% accurate. Sometimes unexpected things happen that can change the outcome. That's why data analysts always look for more data and update their predictions as they get new information.
4. Prescriptive Analysis
Prescriptive analytics is like having a super-smart assistant that helps businesses make good choices. It looks at lots of information and tells them what to do. It keeps them safe by avoiding problems and allows them to use their resources wisely. It's like having a secret weapon to be better than other businesses.
Benefits of Prescriptive Analysis:
Prescriptive analytics is like having a super-smart assistant for businesses.
- It helps businesses make good choices based on lots of information.
- It keeps businesses safe by avoiding problems and risks.
- It allows businesses to use their resources wisely and efficiently.
- It gives businesses an advantage over their competitors.
Want to know more? We've got you covered with a detailed data analytics course.
Challenges of Data Analytics and ways to overcome
Data analytics tools' capabilities are getting improved to meet the ongoing challenges that arise every day. Thus, it can provide valuable insights and become essential to business decision-making across various industries. However, it still needs to work on getting past a few obstacles. The challenges that restrict future development and check risk managers. As a result, the discussion in this section will center on data analysis challenges and their resolutions. Let's Roll.
1. Collecting meaningful insights and data
Getting meaningful insights and data can be difficult when a lot of information comes from different sources. Sometimes, they might end up with already available data or not benefit the company. Also, if the data is not quality, it can affect the accuracy of the analytics. To solve this problem, organizations should invest in managing and cleaning the data. In addition, they need to have procedures to ensure the data is of good quality. It includes checking the data regularly and making sure it's reliable.
By taking these necessary actions, such as implementing data governance and regularly checking the data quality, companies can overcome these challenges and get better insights from their data.
2. Choosing the Right Tools
Selecting the right tools for your organization from the wide range available in the market can be a daunting task. Additionally, it's essential to pick a reputed vendor with a solid track record and excellent customer service.
The best action is to get expert assistance to overcome such challenges. Organizations can get help choosing the best tool from experts with various devices. Additionally, organizations can utilize the tools' demo versions to examine their capabilities. Begin by stating your analytics requirements and goals in specific terms. Consider criteria like capability, scalability, ease of use, integration potential, and pricing while thoroughly evaluating various solutions.
The right tools can analyze lots of data quickly and without mistakes. In addition, they do calculations faster than humans, so analysts can focus on understanding the results. Every business is unique. You can adjust the right tools to get specific needs. You can customize them to work well under particular circumstances. Good analytics tools can handle lots of data and grow with the business. They make sense of information from different sources.
3. Security and data privacy
Keeping data secure and private is important, especially when working with big data. Any IT program must prioritize data security. With increasing concerns about privacy and strict laws, organizations must ensure data security at every stage of the analytics process.
It is easy to overcome these challenges with the right strategy:
- First, look for technologies that can handle large datasets and offer scalable options like distributed processing or cloud-based solutions.
- Make sure the tools you choose can handle the expected increase in data and the analysis workload.
- Consider their processing power, memory, and storage requirements.
It's essential to prioritize data security and privacy in any IT program, especially when dealing with big data. If data gets hacked or stolen, it can cause many problems. For example, it can cost money, disrupt our work, and damage our reputation. Good security helps us avoid these problems and keeps our data safe.
4. Skill Requirements:
Employees need more skills or knowledge to conduct in-depth data analysis. A lack of internal analytics skills may overlook opportunities to expand into new applications. To address these obstacles, consider the training options and help from the user community, and document to ensure your team can develop the skills to use the products efficiently. Finally, this system is accessible to everyone, regardless of ability. It is the best strategy and a good option for your organization. To sustain this, track all progress and find what's lacking.
How has Data Analytics proved Beneficial Across Various Industries?
Data analytics is essential in different industries. Let's look at how it has helped in one sector:
1. Banking and Finance:
In banking and finance, data analytics is essential. Big banks and traders use it to detect fraud, assess risks, calculate credit scores, and analyze investments. It also helps them follow the rules and make better decisions. Data analytics is used for fast trading, understanding customers' feelings, making decisions before trading, and predicting outcomes.
By analyzing lots of financial data, businesses can make more intelligent choices, find unusual things, and reduce risks. Data analytics has proven to be a game-changer for industries, providing valuable insights and improving decision-making processes. We have some more benefits in various sectors.
2. Healthcare and pharmaceuticals
Healthcare experts can predict how treatments will work for current patients by using predictive analytics. They can also use past data to help patients more accurately. For example, let's say a doctor has a patient who is sick. Using data analytics, the doctor can look at information from patients with similar problems. It helps the doctor figure out the best way to help the current patient and make them feel better.
Data analytics also helps doctors observe patients, discover new drugs, prevent illnesses, do research, and make healthcare services better. In addition, it helps create personalized treatment plans, identify people at high risk, and manage the health of a whole population. In summary, data analytics in healthcare and pharmaceuticals helps doctors make better decisions, improves patient care, and makes healthcare services more efficient.
This analysis tremendously impacts the healthcare industry, which currently needs streamlining processes and focuses on the core of healthcare. It might be the revolutionary change the health sector is waiting for.
3. Manufacturing and supply chain
Data analytics is a helpful tool for the manufacturing and supply chain industries. It helps them make things run smoothly and do their work better. So let's see how it helps:
Manufacturing: Data analytics helps manufacturers find problems and make their work better. They look at the data and find places where things get stuck or slow down. Then they figure out ways to improve those parts and make everything work more efficiently.
Supply Chain: In the supply chain, data analytics is essential for managing inventory, shipping, and getting things from one place to another. It helps organizations track what they have and ensure they have enough of everything. This way, they only end up with a little or too little of something.
Data analytics is like a superhero for the manufacturing and supply chain industries. It helps them find problems, improve things, and ensure they have enough of what people need. It's essential for making everything run smoothly and keeping customers happy.
4. Retail and e-commerce industry
Data analytics is essential in the retail industry! It helps stores understand customers, set prices, and give personalized service. By looking at customer data and trends, retailers know what people want to buy. As a result, they can provide a competitive edge over others, sell more, and manage their stock better.
Data analytics helps stores make intelligent choices, make customers happy, and grow their business. It's like having a secret weapon that allows retailers to succeed in the fast-paced retail world. It optimizes pricing strategies based on market trends and customer behaviour. It also enables personalized experiences through tailored recommendations and targeted marketing.

Career Scope in Data Analytics
Does data analysis have a future? If you're overthinking about this, we've got you covered. Data analysis is a promising career path with a need for talented people across various businesses. Additionally, the amount of data in the world as of 2022 was 94 zettabytes, and it will double by 2025.
What are the Job Roles and Specialization Titles in Data Analysis?
Data analytics offers various career types and fields to adapt to multiple interests and skill sets. However, data analyst, data scientist, and data engineer are the three main subfields of work in data analytics.
Let's look at some of the high-demand jobs in data analysis.
- Business Analyst
- Statistician
- Researcher
- Marketing Analyst
- Systems Analyst
- Operation Analyst
The Qualifications Requires to Become a Data Analyst
The minimum eligibility for a data scientist is a statistics, mathematics, or computer science bachelor's degree. Moreover, data analysts can be qualified for entry-level data analyst employment. Students can join right out of school or after completing a certificate program. You can also pursue an online data analytics course to get started with your career in data analysis. Are you eligible enough?
Why Should You Choose Data Analyst as Your Career?
The competitive salary is one of the main reasons to choose data analysis as your career. Due to the strong demand and specialized skills needed, data analytics specialists get reimbursed with lucrative wages.
Moreover, because of new data challenges and technological breakthroughs, the discipline of data analytics is continually changing. Such breakthroughs offer opportunities for ongoing education and career development. Are you planning to join? Meet us at BTres Systems. We provide various IT courses to help you ace the corporate field.
Conclusion
The future of data analytics looks promising; AI and ML will continue to play a vital role in data analytics. With data considered the new oil, data analytics will remain essential for organizations aiming to stay competitive and grow in the data-driven era. Data analytics is an easy tool to convert raw data into useful information. Additionally, given the growing importance of data-driven decision-making, data analytics presents an exciting and lucrative career path.
Frequently Asked Questions
1. What does a data analyst do?
A data analyst collects and examines data to uncover valuable insights and support organizational decision-making. They organize and clean data, analyze it using statistical methods and data analysis tools, and present their findings through reports, visualizations, and presentations.
2. What is the significant difference between data science and data analytics?
Data analytics looks at data to find insights, while data science includes a broader range of activities like gathering and modelling data.
3. What are the primary tools of Data Analytics?
Data analysts use tools like Python, R, SQL, and Tableau to visualise data.
4. What qualities are necessary to work as a data analyst?
To be a data analyst, you should know statistics, be good at handling data, and have programming skills. Due to the advancement in technology, skills and tools are required to work as a data analyst.
Our Lovely Student feedback
Course Schedule
| Name | Date | Details |
|---|---|---|
| Data Analytics Course |
19 Aug 2023
(Sat-Sun) Weekend Batch |
View Details |
| Data Science Training |
26 Aug 2023
(Sat-Sun) Weekend Batch |
View Details |
| Data Science with Python Training |
02 Sept 2023
(Sat-Sun) Weekend Batch |
View Details |
Looking For 100% Salary Hike?
Speak to our course Advisor Now !


